FBI Hate Crime Statistics 2002
Definition
A hate crime, also known as a bias crime, is a criminal
offense committed against a person, property, or society which is motivated,
in whole or in part, by the offender's bias against a race, religion,
disability, sexual orientation, or ethnicity/national origin.
Background
In response to mounting national concern over crimes
motivated by bias, Congress enacted the Hate Crime Statistics Act of
1990 on April 23 of that year. This law required the Attorney General
to collect data "about crimes that manifest evidence of prejudice
based on race, religion, sexual orientation, or ethnicity." The
Attorney General delegated the responsibilities of developing the procedures
for and implementing, collecting, and managing hate crime data to the
Director of the FBI, who in turn assigned the tasks to the Uniform Crime
Reporting (UCR) Program. In September 1994, the Violent Crime Control
and Law Enforcement Act amended the Hate Crime Statistics Act to include
both physical and mental disabilities as potential bias factors, and
the actual collection of disability-bias data began in January 1997.
Additionally, the Church Arson Prevention Act of 1996 mandated that
hate crime data collection become a permanent part of the UCR Program.
Those who developed the guidelines for hate crime data
collection recognized that hate crimes are not separate, distinct crimes;
instead they are traditional offenses motivated by the offender's
bias. After much consideration, the developers decided that hate crime
data could be derived by capturing the additional element of bias in
those offenses already being reported to the UCR Program. Appending
the collection of hate crime statistics to the established UCR data
collection procedures, they concluded, would fulfill the directives
of the Hate Crime Statistics Act without placing an undue additional
reporting burden on law enforcement and, in time, develop a substantial
body of data about the nature and frequency of bias crimes occurring
throughout the Nation. Accordingly, the law enforcement agencies that
participate in the national hate crime program collect details about
an offender's bias motivation associated with the following offense
types: murder and nonnegligent manslaughter, forcible rape, aggravated
assault, simple assault, intimidation, robbery, burglary, larceny-theft,
motor vehicle theft, arson, and destruction/damage/vandalism of property.
(The law enforcement agencies participating in the National Incident-Based
Reporting System also collect additional offense types for crimes against
persons and crimes against property, which the UCR Program publishes
as "other." In addition, these agencies collect hate crime
data for another category called "crimes against society.")
An abstract based on the information received from
law enforcement agencies that provided 1 to 12 months of hate crime
reports during 2002 follows. More detailed information concerning the
characteristics of hate crime can be found in the UCR Program's
annual publication Hate Crime Statistics.
Participation
A total of 12,073 law enforcement agencies participated
in the hate crime program during 2002. Of these agencies, 1,868 agencies
(15.5 percent) submitted 7,462 hate crime incident reports to the FBI.
(See Table 2.36.) The following hate crime abstract is based on the
data received from those law enforcement agencies that provided 1 to
12 months of hate crime reports.
Law Enforcement
Reports
The UCR Program data collection guidelines stipulate
that a hate crime may involve multiple offenses, victims, and offenders
within one incident. Accordingly, in 2002, the 7,462 hate crime incidents
reported to the FBI involved 8,832 separate offenses, 9,222 victims,
and 7,314 known offenders. (See Table 2.33.) (The term known offender does not imply that the identity of the suspect is known but only
that some attribute of the suspect has been identified, distinguishing
him or her from an unknown offender.)
Incidents
Of the total single-bias incidents reported in 2002,
48.8 percent were motivated by racial bias, 19.1 percent were driven
by prejudice against a particular religion, 16.7 percent involved a
sexual-orientation bias, 14.8 percent resulted from a bias against an
ethnicity or national origin, and 0.6 percent were motivated by a disability
bias. (Based on Table 2.33.)
In addition to single-bias incidents, hate crime data
collection guidelines permit the identification of multiple-bias incidents.
These are incidents in which two or more offense types were committed
as a result of two or more bias motivations. Only 3 of the 7,462 incidents
reported in 2002 met that criteria. (See Table 2.33.)
Offenses
A victim of an offense, according to the UCR definition,
may be either a person, a business, an institution, or society as a
whole. When aggregating the number of hate crime offenses committed
against individuals, the program counts one offense for each victim.
The offense types of murder, rape, aggravated assault, simple assault,
and intimidation are possible crimes against persons. When counting
crimes against property, the program allots one offense for each distinct
incident regardless of the number of victims. Robbery, burglary, larceny-theft,
motor vehicle theft, arson, and destruction/damage/vandalism comprise
the offense types that are possible crimes against property.
During 2002, a total of 5,960 (67.5 percent) of reported
hate crime offenses were crimes against persons, and 2,823 (32.0 percent)
were crimes against property. (Crimes against society comprised 0.6
percent of the reported offenses.) Intimidation continued to be the
most frequently reported hate crime against individuals and accounted
for 52.1 percent of all crimes against persons. Destruction/damage/vandalism
of property was the most frequently reported crime against property.
Of the instances of crimes against property, 83.1 percent were for the
offenses of destruction/damage/vandalism. (Based on Table 2.34.)
Victims
A total of 9,222 individuals, businesses, institutions,
or society as a whole were victims of hate crimes in 2002. Approximately
49.7 percent of all single-bias hate crime victims were targets of racial
prejudice. Of these victims, 67.2 percent were attacked because of an
anti-black bias motivation, and 19.9 percent were attacked because of
an anti-white bias motivation. Eighteen percent of single-bias hate
crime victims were targets because of the offender's bias toward
the victim's religion. Of these, 65.3 percent were targeted because
of an anti-Jewish bias motivation. Additionally, 16.4 percent of total
single-bias hate crime victims were attacked because of the offender's
prejudice against the victim's sexual-orientation; among these victims,
65.0 percent were victims of an anti-male homosexual bias motivation.
Approximately 15.3 percent of hate crime victims were targets of ethnicity/national
origin bias. Of these, 45.4 percent were victims of anti-Hispanic sentiment.
(Based on Table 2.33.)
Offenders
In 2002, there were 7,314 known offenders who committed
crimes motivated by biases. The majority of these known hate crime offenders
were white, 61.8 percent; 21.8 percent were black; 1.2 percent were
Asian or Pacific Islander; 0.6 percent were American Indian or Alaskan
Native; 9.8 percent were of unknown race; and 4.9 percent were groups
of offenders consisting of multiple races. (Based on Table 2.35.)
Figure 2.19
Bias-motivated Offenses
Percent Distribution 1 2002
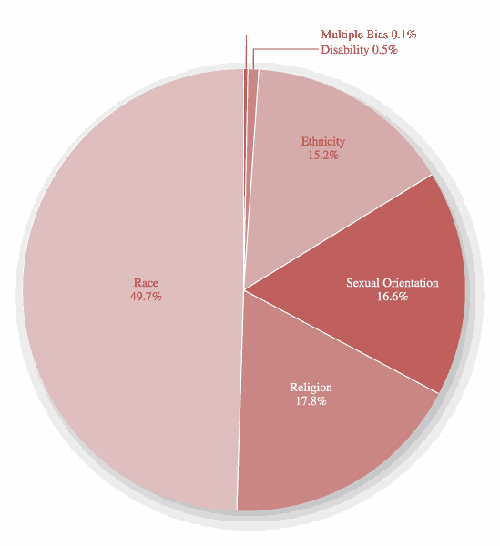
Table 2.33
Incidents, Offenses, Victims, and Known Offenders
by Bias Motivation, 2002
|
Bias motivation |
Incidents |
Offenses |
Victims1 |
Known offenders2 |
|
| Total |
7,462 |
8,832 |
9,222 |
7,314 |
| |
|
|
|
|
| Single-Bias Incidents |
7,459 |
8,825 |
9,211 |
7,311 |
| |
|
|
|
|
| Race: |
3,642 |
4,393 |
4,580 |
4,011 |
| Anti-White |
719 |
888 |
910 |
1,064 |
| Anti-Black |
2,486 |
2,967 |
3,076 |
2,510 |
| Anti-American Indian/Alaskan Native |
62 |
68 |
72 |
52 |
| Anti-Asian/Pacific Islander |
217 |
268 |
280 |
242 |
| Anti-Multiple Races, Group |
158 |
202 |
242 |
143 |
| |
|
|
|
|
| Religion: |
1,426 |
1,576 |
1,659 |
568 |
| Anti-Jewish |
931 |
1,039 |
1,084 |
317 |
| Anti-Catholic |
53 |
58 |
71 |
21 |
| Anti-Protestant |
55 |
57 |
58 |
34 |
| Anti-Islamic |
155 |
170 |
174 |
103 |
| Anti-Other Religion |
198 |
217 |
237 |
73 |
| Anti-Multiple Religions, Group |
31 |
32 |
32 |
18 |
| Anti-Atheism/Agnosticism/etc. |
3 |
3 |
3 |
2 |
| |
|
|
|
|
| Sexual Orientation: |
1,244 |
1,464 |
1,513 |
1,438 |
| Anti-Male Homosexual |
825 |
957 |
984 |
1,022 |
| Anti-Female Homosexual |
172 |
207 |
221 |
172 |
| Anti-Homosexual |
222 |
259 |
267 |
225 |
| Anti-Heterosexual |
10 |
26 |
26 |
6 |
| Anti-Bisexual |
15 |
15 |
15 |
13 |
| |
|
|
|
|
| Ethnicity/National Origin: |
1,102 |
1,345 |
1,409 |
1,247 |
| Anti-Hispanic |
480 |
601 |
639 |
656 |
| Anti-Other Ethnicity/National Origin |
622 |
744 |
770 |
591 |
| |
|
|
|
|
| Disability: |
45 |
47 |
50 |
47 |
| Anti-Physical |
20 |
20 |
20 |
21 |
| Anti-Mental |
25 |
27 |
30 |
26 |
| |
|
|
|
|
| Multiple-Bias Incidents3 |
3 |
7 |
11 |
3 |
|
3 A multiple-bias incident only occurs when two or more offense types are
committed in a single incident. In a situation when
there is more than one offense type, the agency can indicate a different
bias type for each offense. In the case of a single
offense type, only one bias type can be indicated.
Back to Top
Table 2.34
Incidents, Offenses, Victims, and Known Offenders
by Offense Type, 2002
|
Offense type |
Incidents1 |
Offenses |
Victims2 |
Known offenders3 |
|
| Total |
7,462 |
8,832 |
9,222 |
7,314 |
| |
|
|
|
|
| Crimes against persons: |
4,784 |
5,960 |
5,960 |
6,090 |
| Murder and nonnegligent manslaughter |
11 |
11 |
11 |
15 |
| Forcible rape |
8 |
8 |
8 |
16 |
| Aggravated assault |
800 |
1,035 |
1,035 |
1,498 |
| Simple assault |
1,473 |
1,791 |
1,791 |
2,436 |
| Intimidation |
2,484 |
3,105 |
3,105 |
2,117 |
| Other4 |
8 |
10 |
10 |
8 |
| |
|
|
|
|
| Crimes against property: |
2,823 |
2,823 |
3,213 |
1,423 |
| Robbery |
131 |
131 |
179 |
269 |
| Burglary |
131 |
131 |
163 |
86 |
| Larceny-theft |
151 |
151 |
157 |
95 |
| Motor vehicle theft |
9 |
9 |
9 |
3 |
| Arson |
38 |
38 |
47 |
27 |
| Destruction/damage/vandalism |
2,347 |
2,347 |
2,642 |
927 |
| Other4 |
16 |
16 |
16 |
16 |
| |
|
|
|
|
| Crimes against society4 |
49 |
49 |
49 |
61 |
|
Back to Top
Table 2.35
Race of Known Offenders, 20021
|
Known offender's race |
No. |
|
| Total |
7,314 |
| |
|
| White |
4,517 |
| Black |
1,592 |
| American Indian/Alaskan Native |
43 |
| Asian/Pacific Islander |
87 |
| Multiple Races, Group2 |
355 |
| Unknown Race |
720 |
|
Table 2.36
Agency Hate Crime Reporting by State, 2002
|
Participating state |
Number of
participating
agencies |
Population covered |
Agencies submitting
incident reports |
Total number of
incidents reported |
|
| Total |
12,073 |
247,246,683 |
1,868 |
7,462 |
| |
|
|
|
|
| Alabama |
31 |
259,938 |
2 |
2 |
| Alaska |
1 |
267,280 |
1 |
7 |
| Arizona |
88 |
5,023,657 |
29 |
238 |
| Arkansas |
7 |
387,957 |
0 |
0 |
| California |
726 |
35,056,859 |
243 |
1,648 |
| Colorado |
190 |
4,251,762 |
30 |
96 |
| Connecticut |
84 |
2,838,717 |
50 |
129 |
| Delaware |
50 |
806,717 |
8 |
13 |
| District of Columbia |
2 |
570,898 |
2 |
14 |
| Florida |
489 |
16,660,424 |
93 |
257 |
| Georgia |
76 |
1,558,760 |
10 |
31 |
| Idaho |
117 |
1,330,416 |
14 |
43 |
| Illinois |
59 |
4,639,084 |
46 |
155 |
| Indiana |
163 |
4,476,334 |
25 |
77 |
| Iowa |
221 |
2,863,046 |
18 |
46 |
| Kansas |
339 |
2,366,821 |
13 |
55 |
| Kentucky |
341 |
3,663,360 |
38 |
76 |
| Louisiana |
159 |
3,418,556 |
13 |
15 |
| Maine |
180 |
1,291,128 |
14 |
36 |
| Maryland |
148 |
5,458,137 |
26 |
211 |
| Massachusetts |
305 |
5,822,308 |
90 |
430 |
| Michigan |
619 |
9,814,593 |
164 |
416 |
| Minnesota |
279 |
4,843,609 |
71 |
203 |
| Mississippi |
66 |
942,735 |
3 |
3 |
| Missouri |
144 |
2,955,399 |
19 |
64 |
| Montana |
93 |
881,473 |
6 |
13 |
| Nebraska |
203 |
1,362,661 |
17 |
74 |
| Nevada |
35 |
2,173,491 |
7 |
62 |
| New Hampshire |
107 |
654,470 |
19 |
27 |
| New Jersey |
557 |
8,590,300 |
220 |
570 |
| New Mexico |
49 |
1,180,982 |
3 |
15 |
| New York |
505 |
19,154,571 |
63 |
693 |
| North Carolina |
446 |
8,242,488 |
29 |
62 |
| North Dakota |
74 |
562,980 |
7 |
18 |
| Ohio |
400 |
8,244,818 |
63 |
263 |
| Oklahoma |
301 |
3,493,714 |
19 |
44 |
| Oregon |
172 |
3,509,432 |
24 |
61 |
| Pennsylvania |
849 |
11,086,040 |
26 |
92 |
| Rhode Island |
48 |
1,069,725 |
7 |
38 |
| South Carolina |
310 |
4,103,856 |
35 |
70 |
| South Dakota |
130 |
734,731 |
4 |
4 |
| Tennessee |
443 |
5,796,102 |
54 |
129 |
| Texas |
969 |
21,698,160 |
82 |
347 |
| Utah |
59 |
1,790,393 |
17 |
54 |
| Vermont |
57 |
565,746 |
10 |
18 |
| Virginia |
399 |
7,258,150 |
54 |
291 |
| Washington |
246 |
6,036,923 |
47 |
174 |
| West Virginia |
336 |
1,758,307 |
16 |
41 |
| Wisconsin |
370 |
5,438,068 |
13 |
32 |
| Wyoming |
31 |
290,607 |
4 |
5 |
| |
|
Source: FBI
|