Israel Economic Indicators: Per Capita GDP
(1960 - Present)
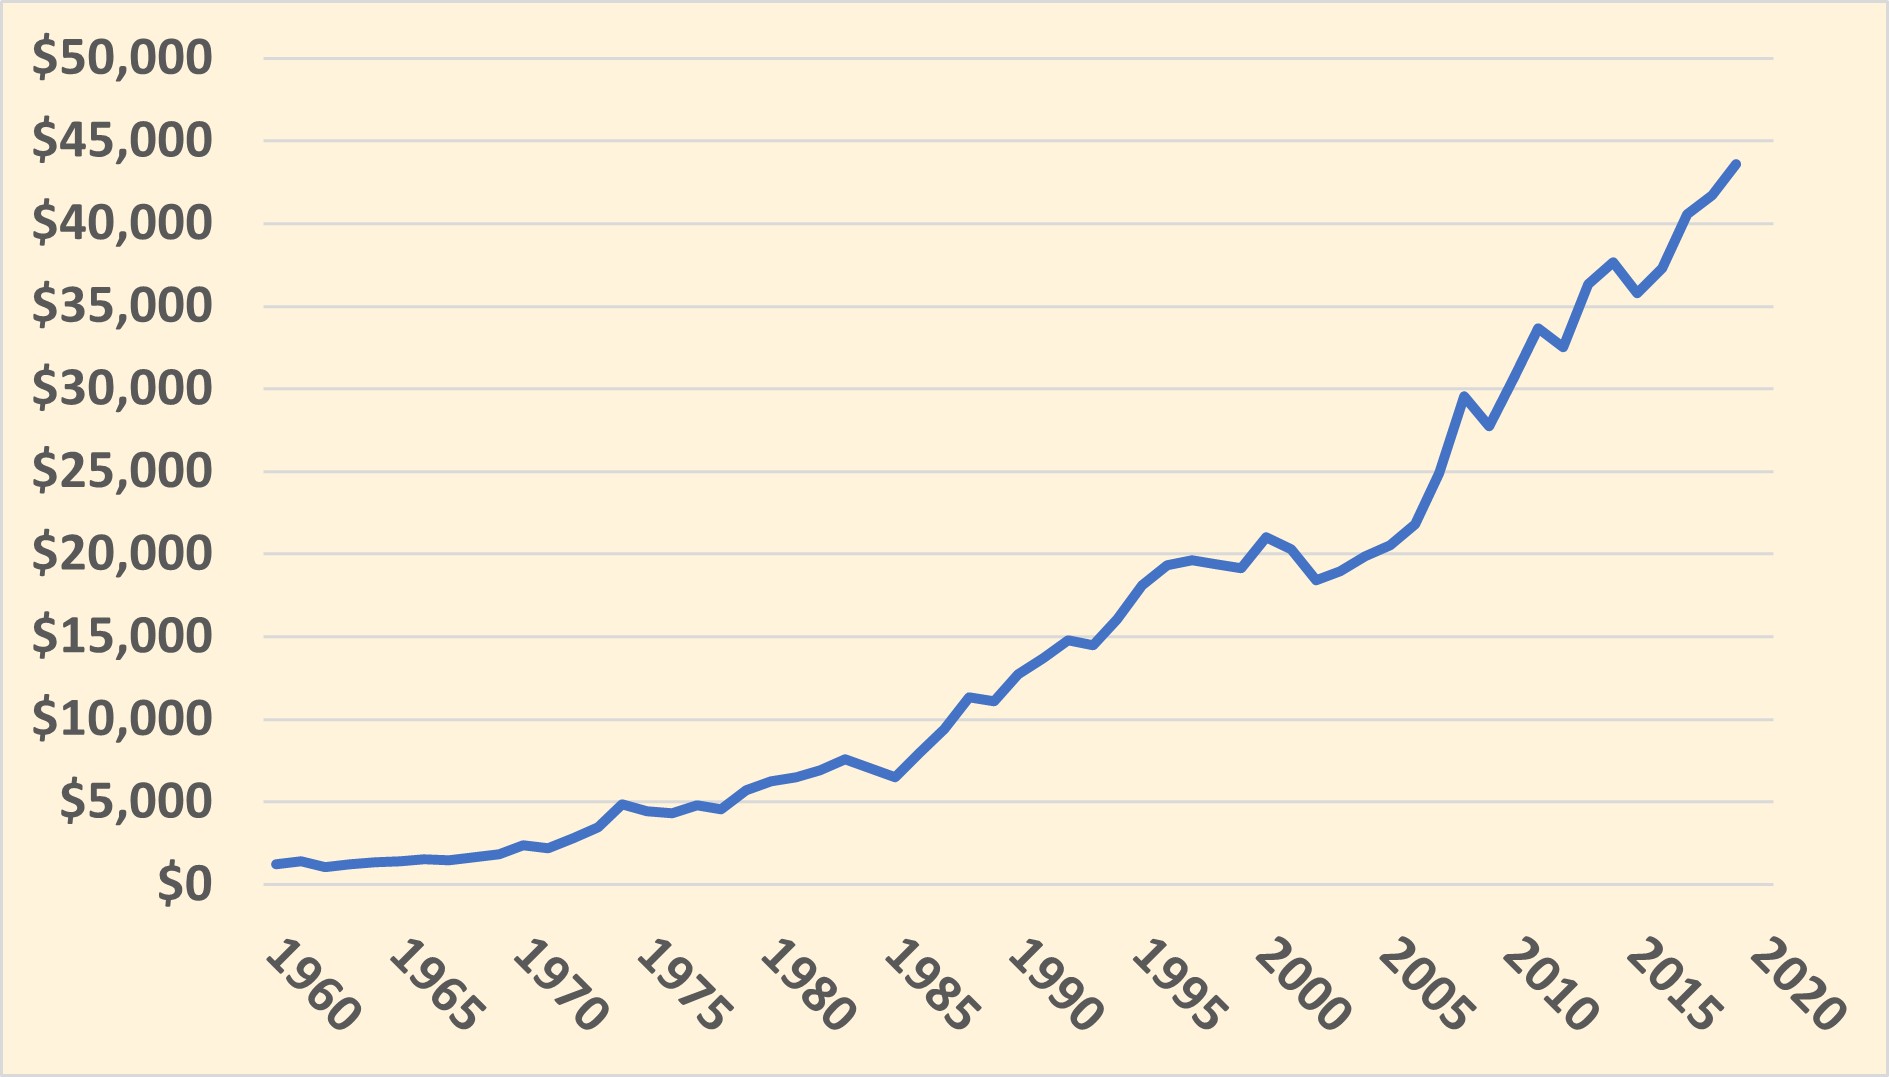
| Year | Per Capita $ | % Change |
|
2019
|
$43,592 | 4.3% |
|
2018
|
$41,720 | 2.8% |
|
2017
|
$40,542 | 7.9% |
|
2016
|
$37,322 | 4.1% |
|
2015
|
$35,777 | -5.3% |
|
2014
|
$37,679 | 3.6% |
|
2013
|
$36,309 | 10.5% |
|
2012
|
$32,511 | -3.6% |
|
2011
|
$33,669 | 8.8% |
|
2010
|
$30,694 | 9.7% |
|
2009
|
$27,716 | -6.7% |
|
2008
|
$29,568 | 15.7% |
|
2007
|
$24,924 | 12.4% |
|
2006
|
$21,837 | 5.8% |
|
2005
|
$20,567 | 3.3% |
|
2004
|
$19,897 | 4.6% |
|
2003
|
$18,979 | 2.9% |
|
2002
|
$18,436 | -10.1% |
|
2001
|
$20,307 | -3.6% |
|
2000
|
$21,044 | 9.1% |
|
1999
|
$19,120 | -1.5% |
|
1998
|
$19,416 | -1.2% |
|
1997
|
$19,653 | 1.7% |
|
1996
|
$19,325 | 6.3% |
|
1995
|
$18,104 | 11.4% |
|
1994
|
$16,048 | 9.7% |
|
1993
|
$14,494 | -2.2% |
|
1992
|
$14,810 | 7.5% |
|
1991
|
$13,698 | 7.2% |
|
1990
|
$12,708 | 12.8% |
|
1989
|
$11,084 | -2.1% |
|
1988
|
$11,318 | 16.9% |
|
1987
|
$9,409 | 15.4% |
|
1986
|
$7,959 | 18.1% |
|
1985
|
$6,520 | -7.9% |
|
1984
|
$7,036 | -8.0% |
|
1983
|
$7,601 | 8.8% |
|
1982
|
$6,930 | 6.4% |
|
1981
|
$6,488 | 3.6% |
|
1980
|
$6,253 | 8.8% |
|
1979
|
$5,702 | 19.7% |
|
1978
|
$4,580 | -5.3% |
|
1977
|
$4,825 | 10.6% |
|
1976
|
$4,313 | -3.4% |
|
1975
|
$4,461 | -8.8% |
|
1974
|
$4,856 | 28.6% |
|
1973
|
$3,467 | 19.3% |
|
1972
|
$2,797 | 21.5% |
|
1971
|
$2,195 | -8.4% |
|
1970
|
$2,378 | 22.1% |
|
1969
|
$1,852 | 11.0% |
|
1968
|
$1,648 | 10.9% |
|
1967
|
$1,468 | -3.1% |
|
1966
|
$1,514 | 5.6% |
|
1965
|
$1,429 | 3.7% |
|
1964
|
$1,376 | 8.6% |
|
1963
|
$1,258 | 13.0% |
|
1962
|
$1,095 | -31.2% |
|
1961
|
$1,436 | 14.4% |
|
1960
|
$1,229 |
Sources: Israeli Ministry of Finance; Israeli Foreign Ministry; Bank of Israel
Download our mobile app for on-the-go access to the Jewish Virtual Library